
March 9, 2016
Data Analytics for IoT
By Exosite · 7 min read · Articles
The era of big data is here. With IoT, companies have access to more information than ever — connected pumps whose performance shows up on a tablet, connected pest-control traps that text a sanitation worker, connected thermostats controlled from a phone. But a staggering amount of information gathered every day isn’t necessarily being used effectively by the companies that have access to it. As the Financial Times’ Tim Harford put it, “Big data has arrived, but big insights have not.” Useful data analysis requires much more than simply collecting and summarizing data — it requires a long-term analytics strategy, starting with a solid foundation of connected devices and a purposeful data pipeline, from gathering data to acting on algorithmic predictions.
Data without context is meaningless.
Closing the gap to decision
Data analysis is the process of gleaning new insight out of data sets to more intimately understand the data and the behavior it explains. Historically, most of this has been done manually with languages like R, Python, or SAS — but the explosion of IoT makes it increasingly practical to encode much of that analysis into machines instead. Real-time sensor data made available by connected devices opens up new opportunities for on-the-go analysis and programmed decision-making, delivering a kind of visibility into products that was previously unattainable — from real-time stream analytics that trigger pre-programmed decisions as data arrives, to analytics code pushed directly to a device or gateway when connectivity isn’t reliable.
As data is used more effectively, the distance human input has to travel to make a decision shrinks. In an increasingly competitive market for connected products, the maturity of a data analysis program can be the difference between merely surviving and fully transforming into an industry-leading connected product company — reducing costs, monetizing a connected product, and preventing costly downtime.
A standardized data collection process comes down to three questions:
- What questions need to be answered with data analysis?
- What data is needed to support the answers to those questions?
- How do you gather the correct type and amount of that data?
Even the most sophisticated analysis can’t replace the input data it depends on. In-house product expertise is irreplaceable here — pump designers don’t need extensive data analysis to tell them that vibration, temperature, and pressure are the key metrics for predicting pump failure. An engineer’s intimate understanding of a product will often point data analysis precisely where it needs to go, and collaboration between product and IoT experts yields the right data resolution standards: some situations call for a sensor reading every fraction of a second, others only need minute-level resolution.
The stages of analytics maturity
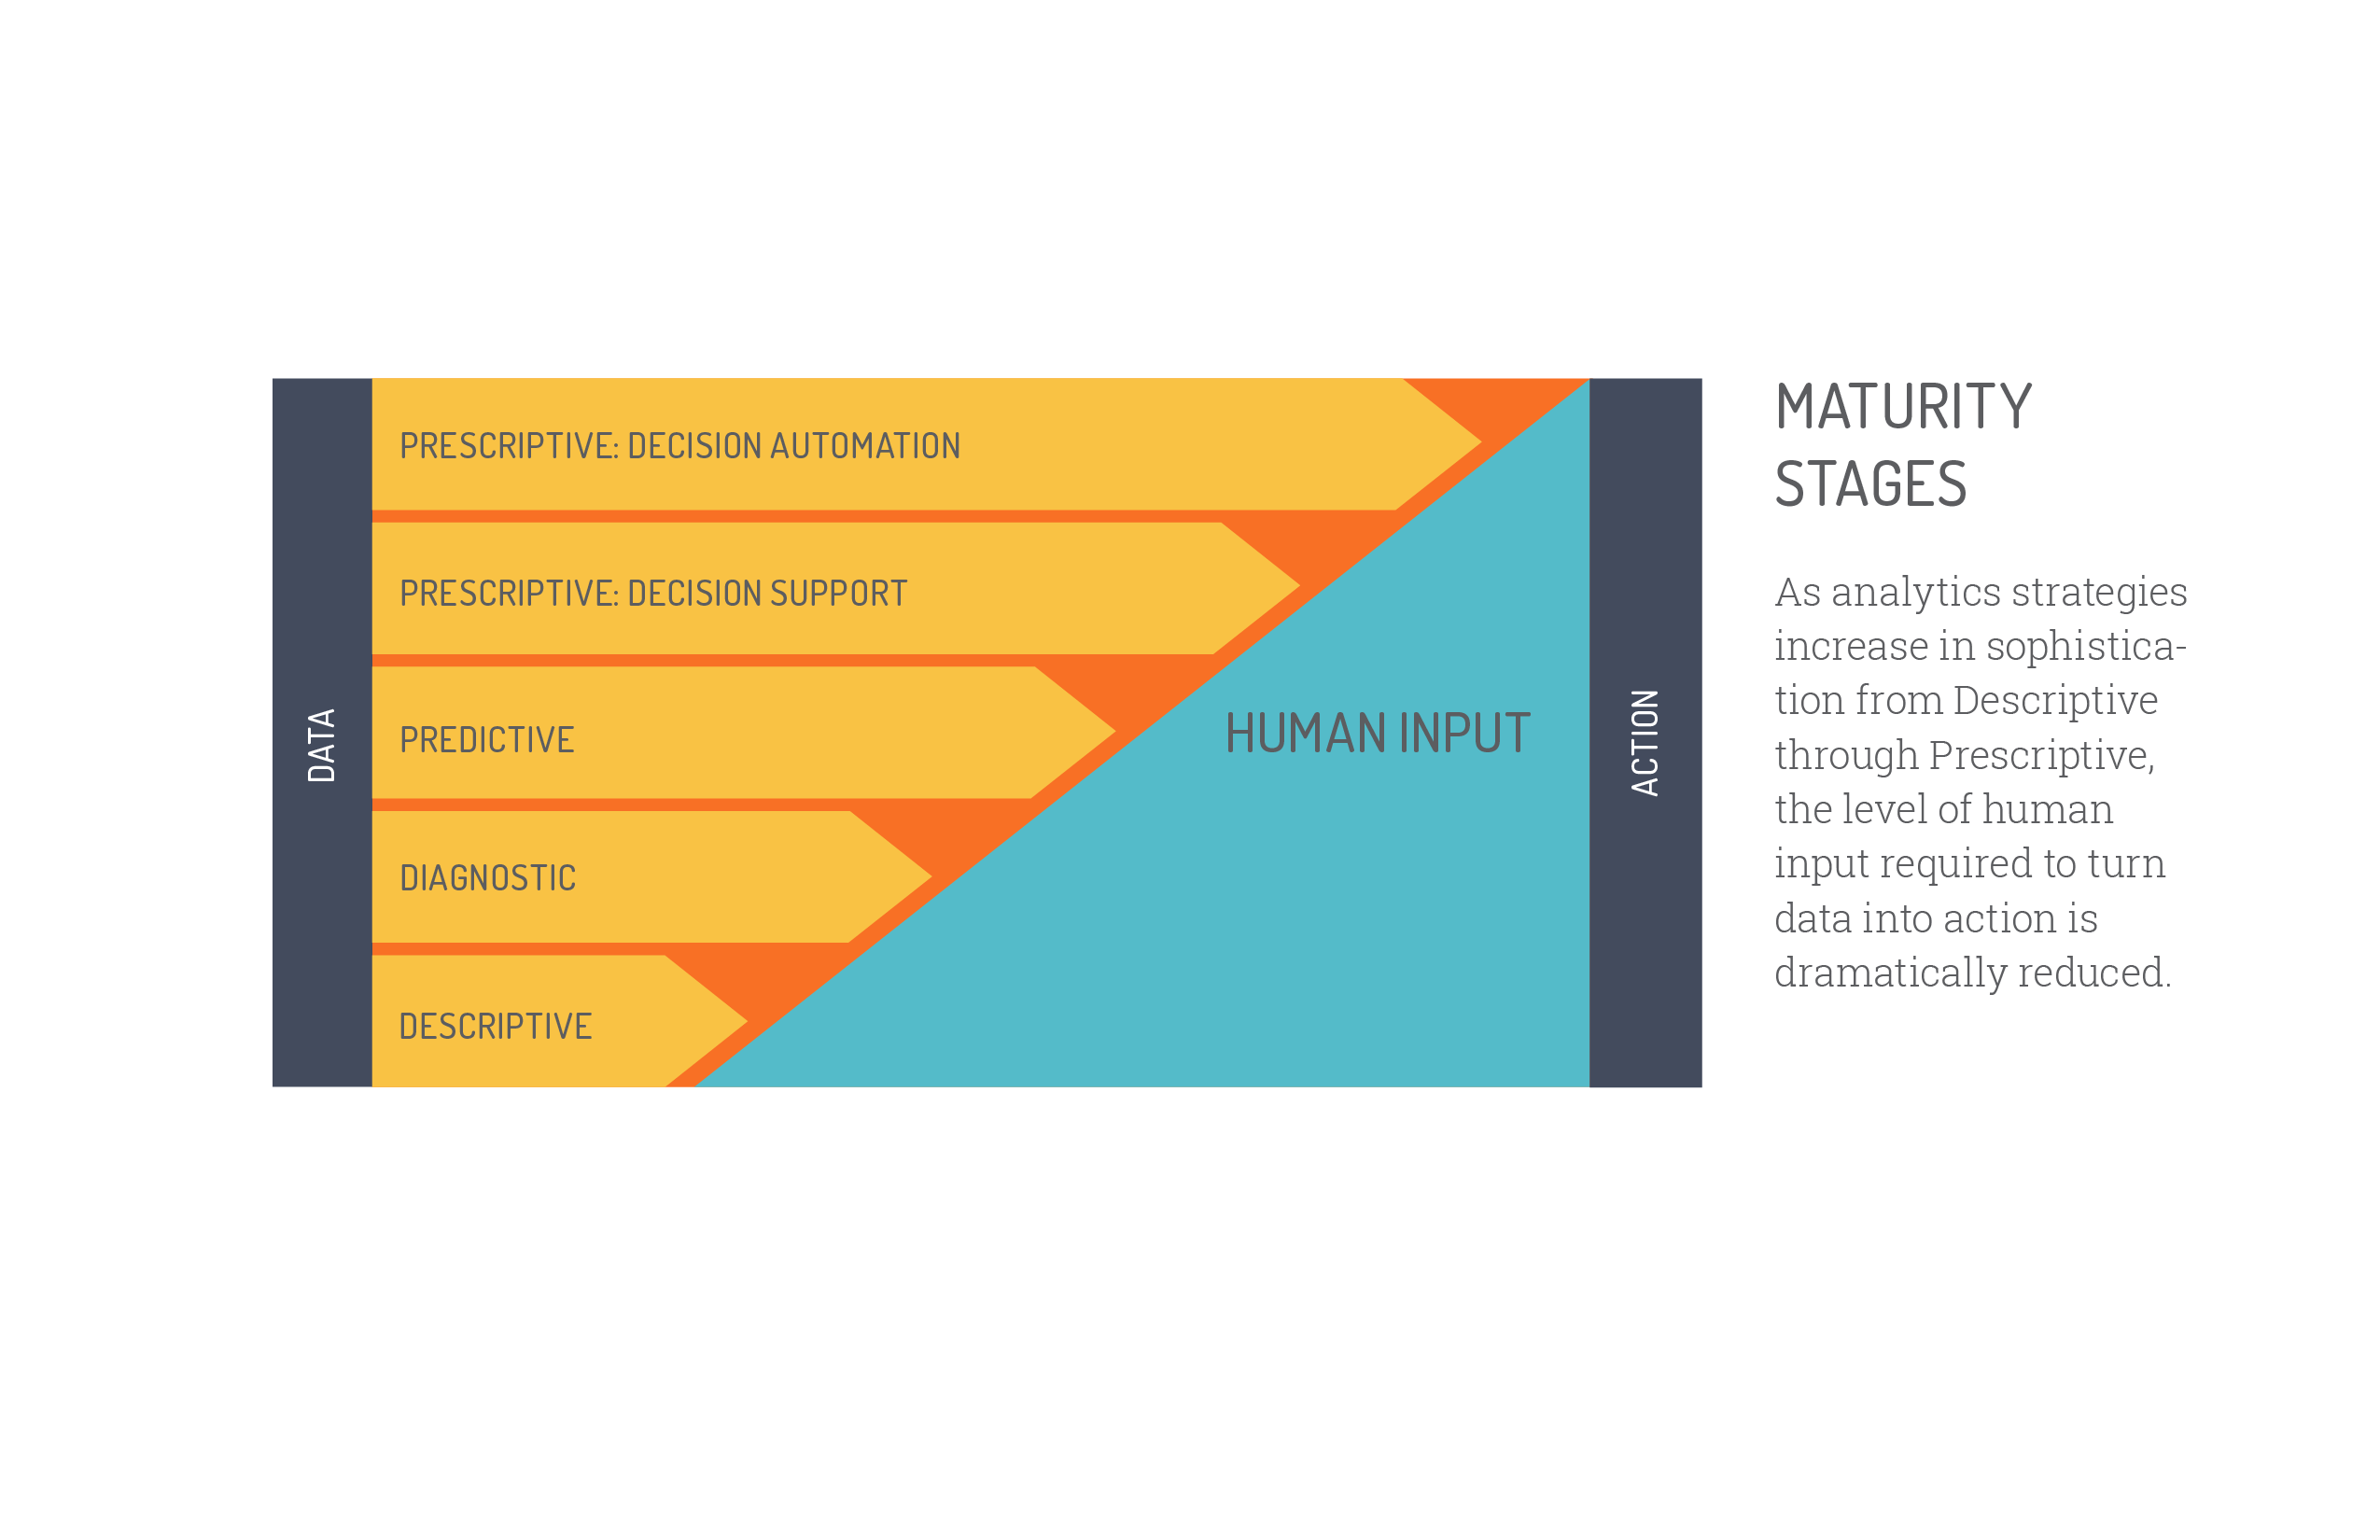
As analytics strategies mature from descriptive through prescriptive, the human input required to turn information into action drops dramatically — reducing cost and improving efficiency, results, and customer experience.
Descriptive analytics: what happened?
The first stage describes what’s happening across a connected fleet — average pressure, maximum daily runtime, longest stretch at peak pressure. The typical measurements here are moving averages, standard deviations, histograms, and quartiles; descriptive analytics doesn’t dig into causes, but it’s the foundation everything else is built on. Imagine an industrial pump with an average pressure of 600 PSI that never exceeds 650 PSI for more than a few seconds — descriptive analytics is what lets a technician notice the pump has been running at 700 PSI for several minutes and flag it before it fails.
Diagnostic analytics: why did it happen?
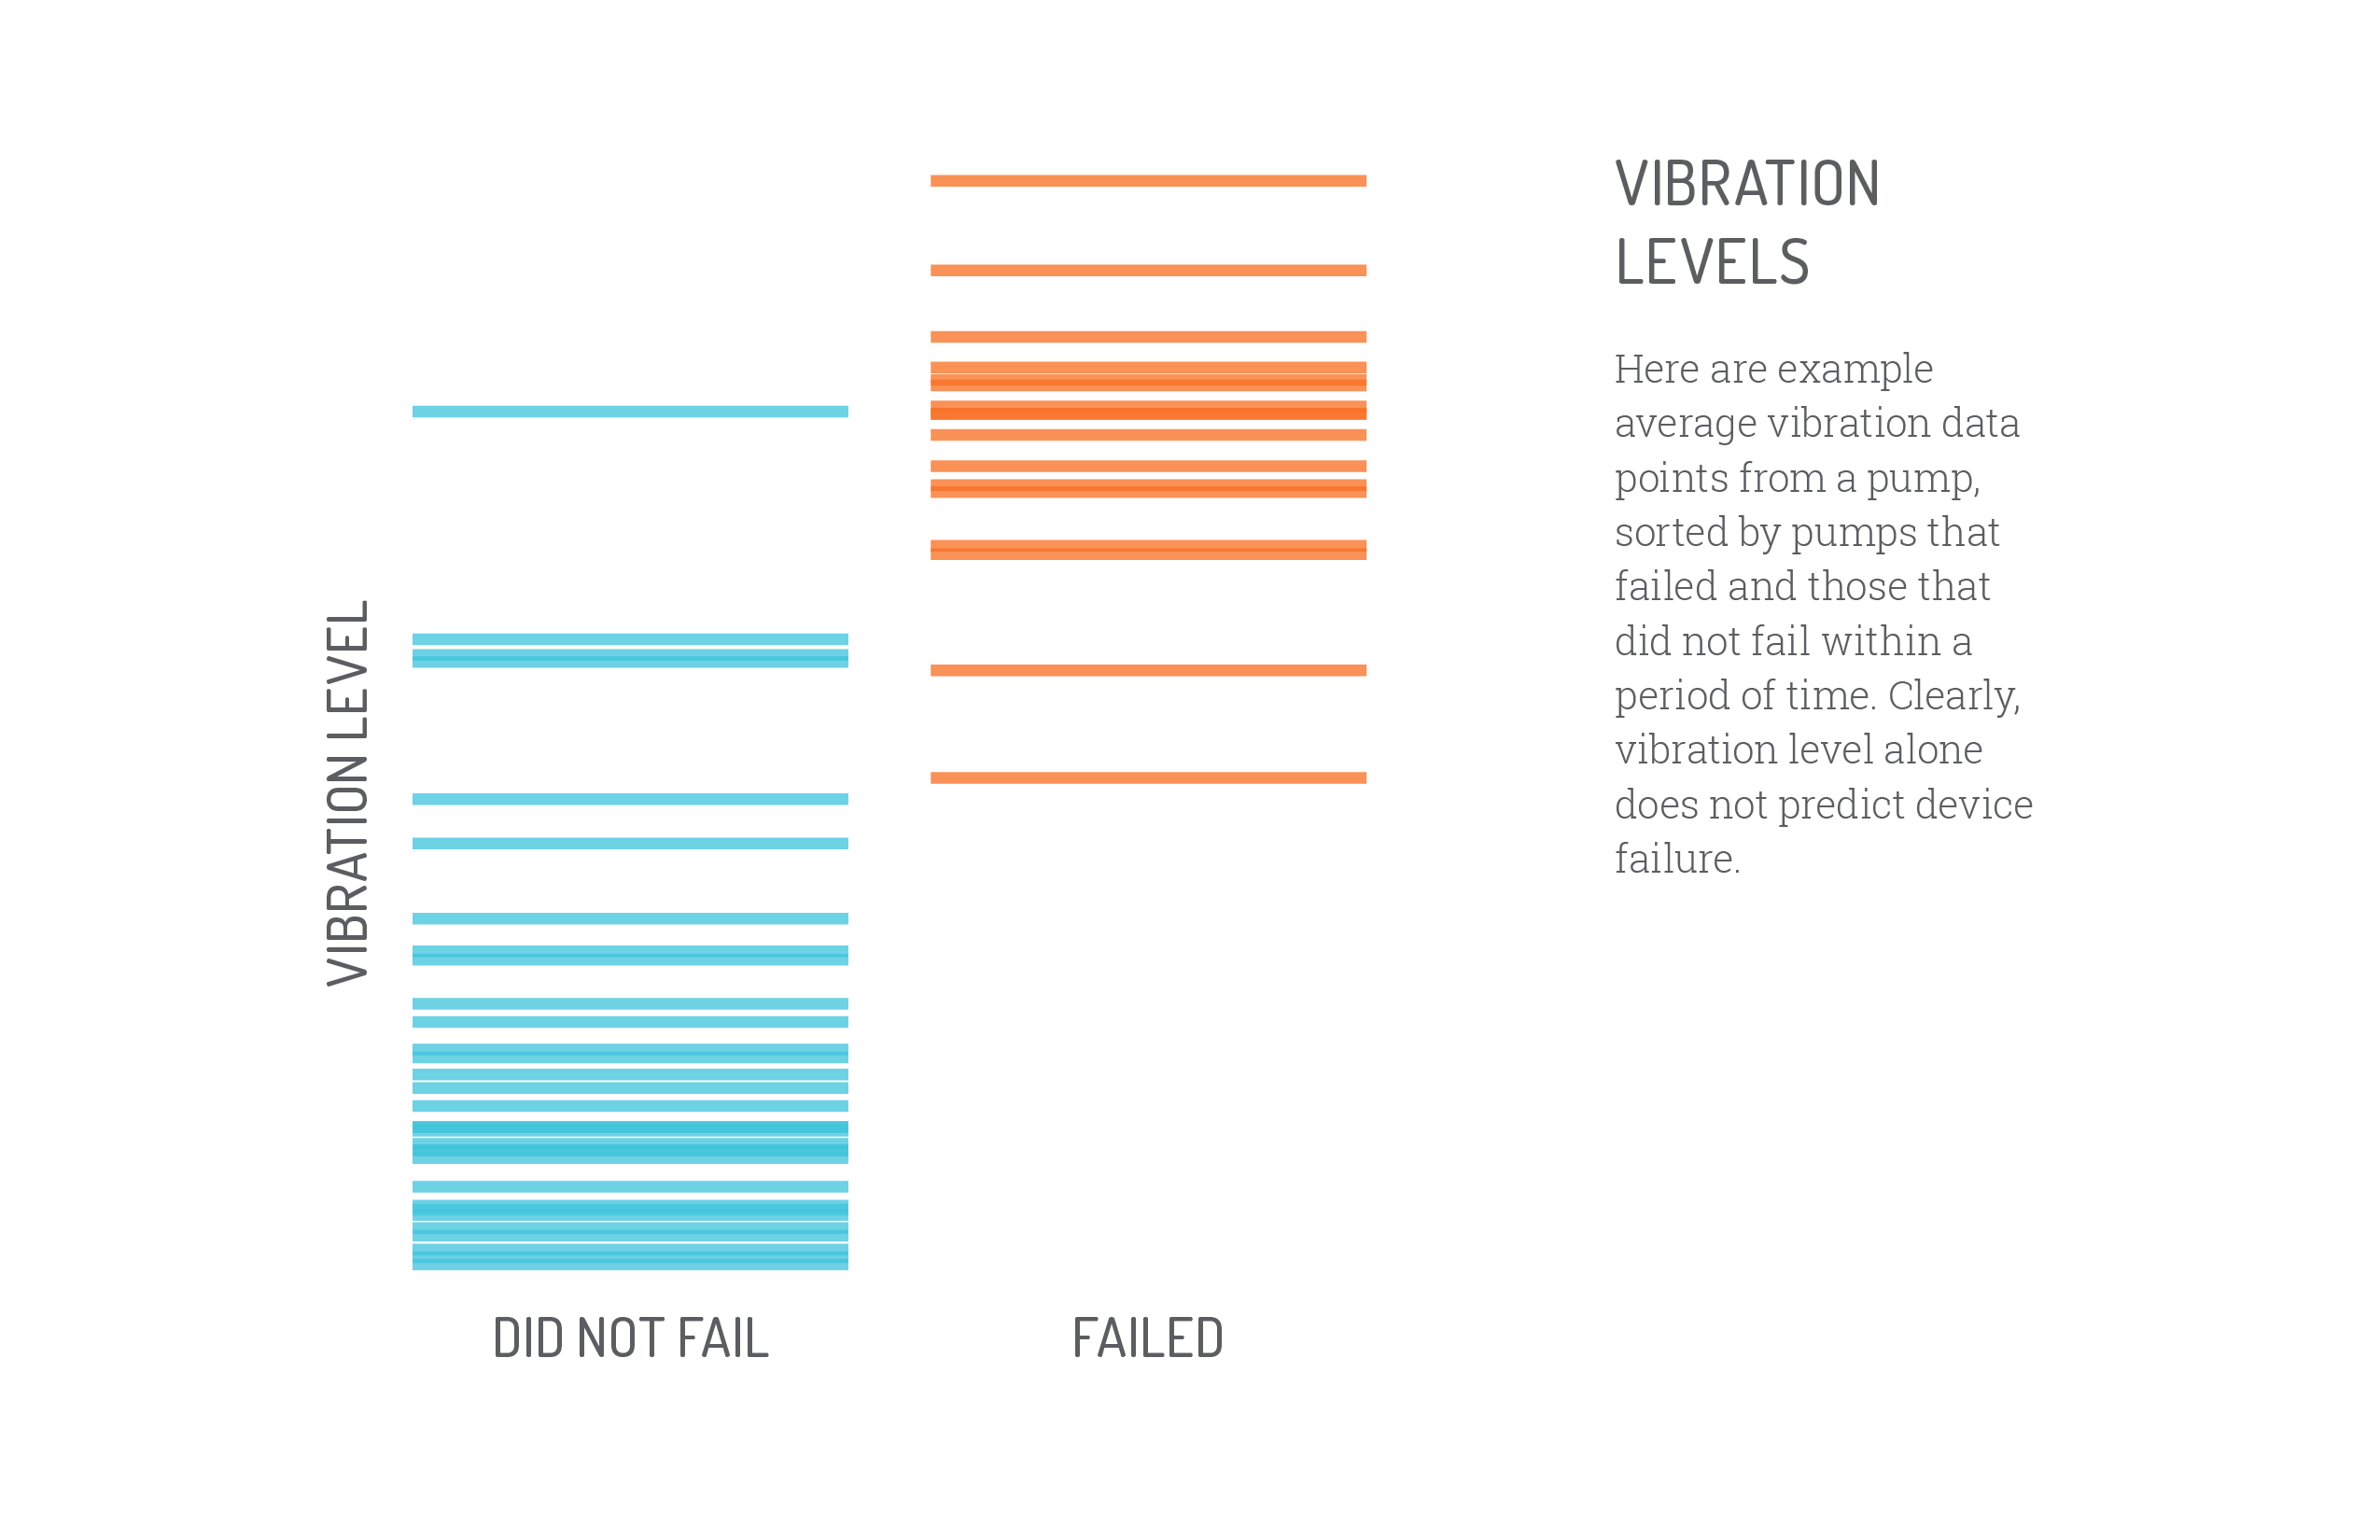
Digging deeper into descriptive data often reveals that a failure or unexpected behavior was linked to an anomaly beforehand. Continuing the pump example: vibration is one of the most common causes of pump failure, whether from a failing bearing or a shock the pump wasn’t built to withstand. Diagnostic analytics links the descriptive statistics — an increase in vibration — to the eventual failure, letting technicians act on it going forward or push for higher vibration tolerances in future designs. If a failure can’t be diagnosed from the data you already have, that’s a sign you need to collect more — additional metrics, or higher-granularity sampling.
Predictive analytics: what will happen?
Once diagnostic analytics has identified causal relationships between past behavior and events, you can start projecting probable behavior into the future. The payoff is real: proactive maintenance scheduling instead of unexpected downtime, and avoiding the brand damage that comes with unpredictable failures. Machine learning is the tool that makes this scale — a system that applies statistical learning techniques to identify patterns in data, adjust as more data arrives, and make increasingly accurate predictions, retrainable whenever conditions change (a device upgrade, for instance). A few of the key techniques:
- Cluster analysis groups devices by their attributes — including metadata like age, model, or manufacture date — to predict behavior. For a fleet of connected elevators, cluster analysis might reveal that units serviced more than twelve months ago and running over eight hours a day account for most of the fleet’s downtime, giving the manufacturer a clear, prioritized maintenance schedule.
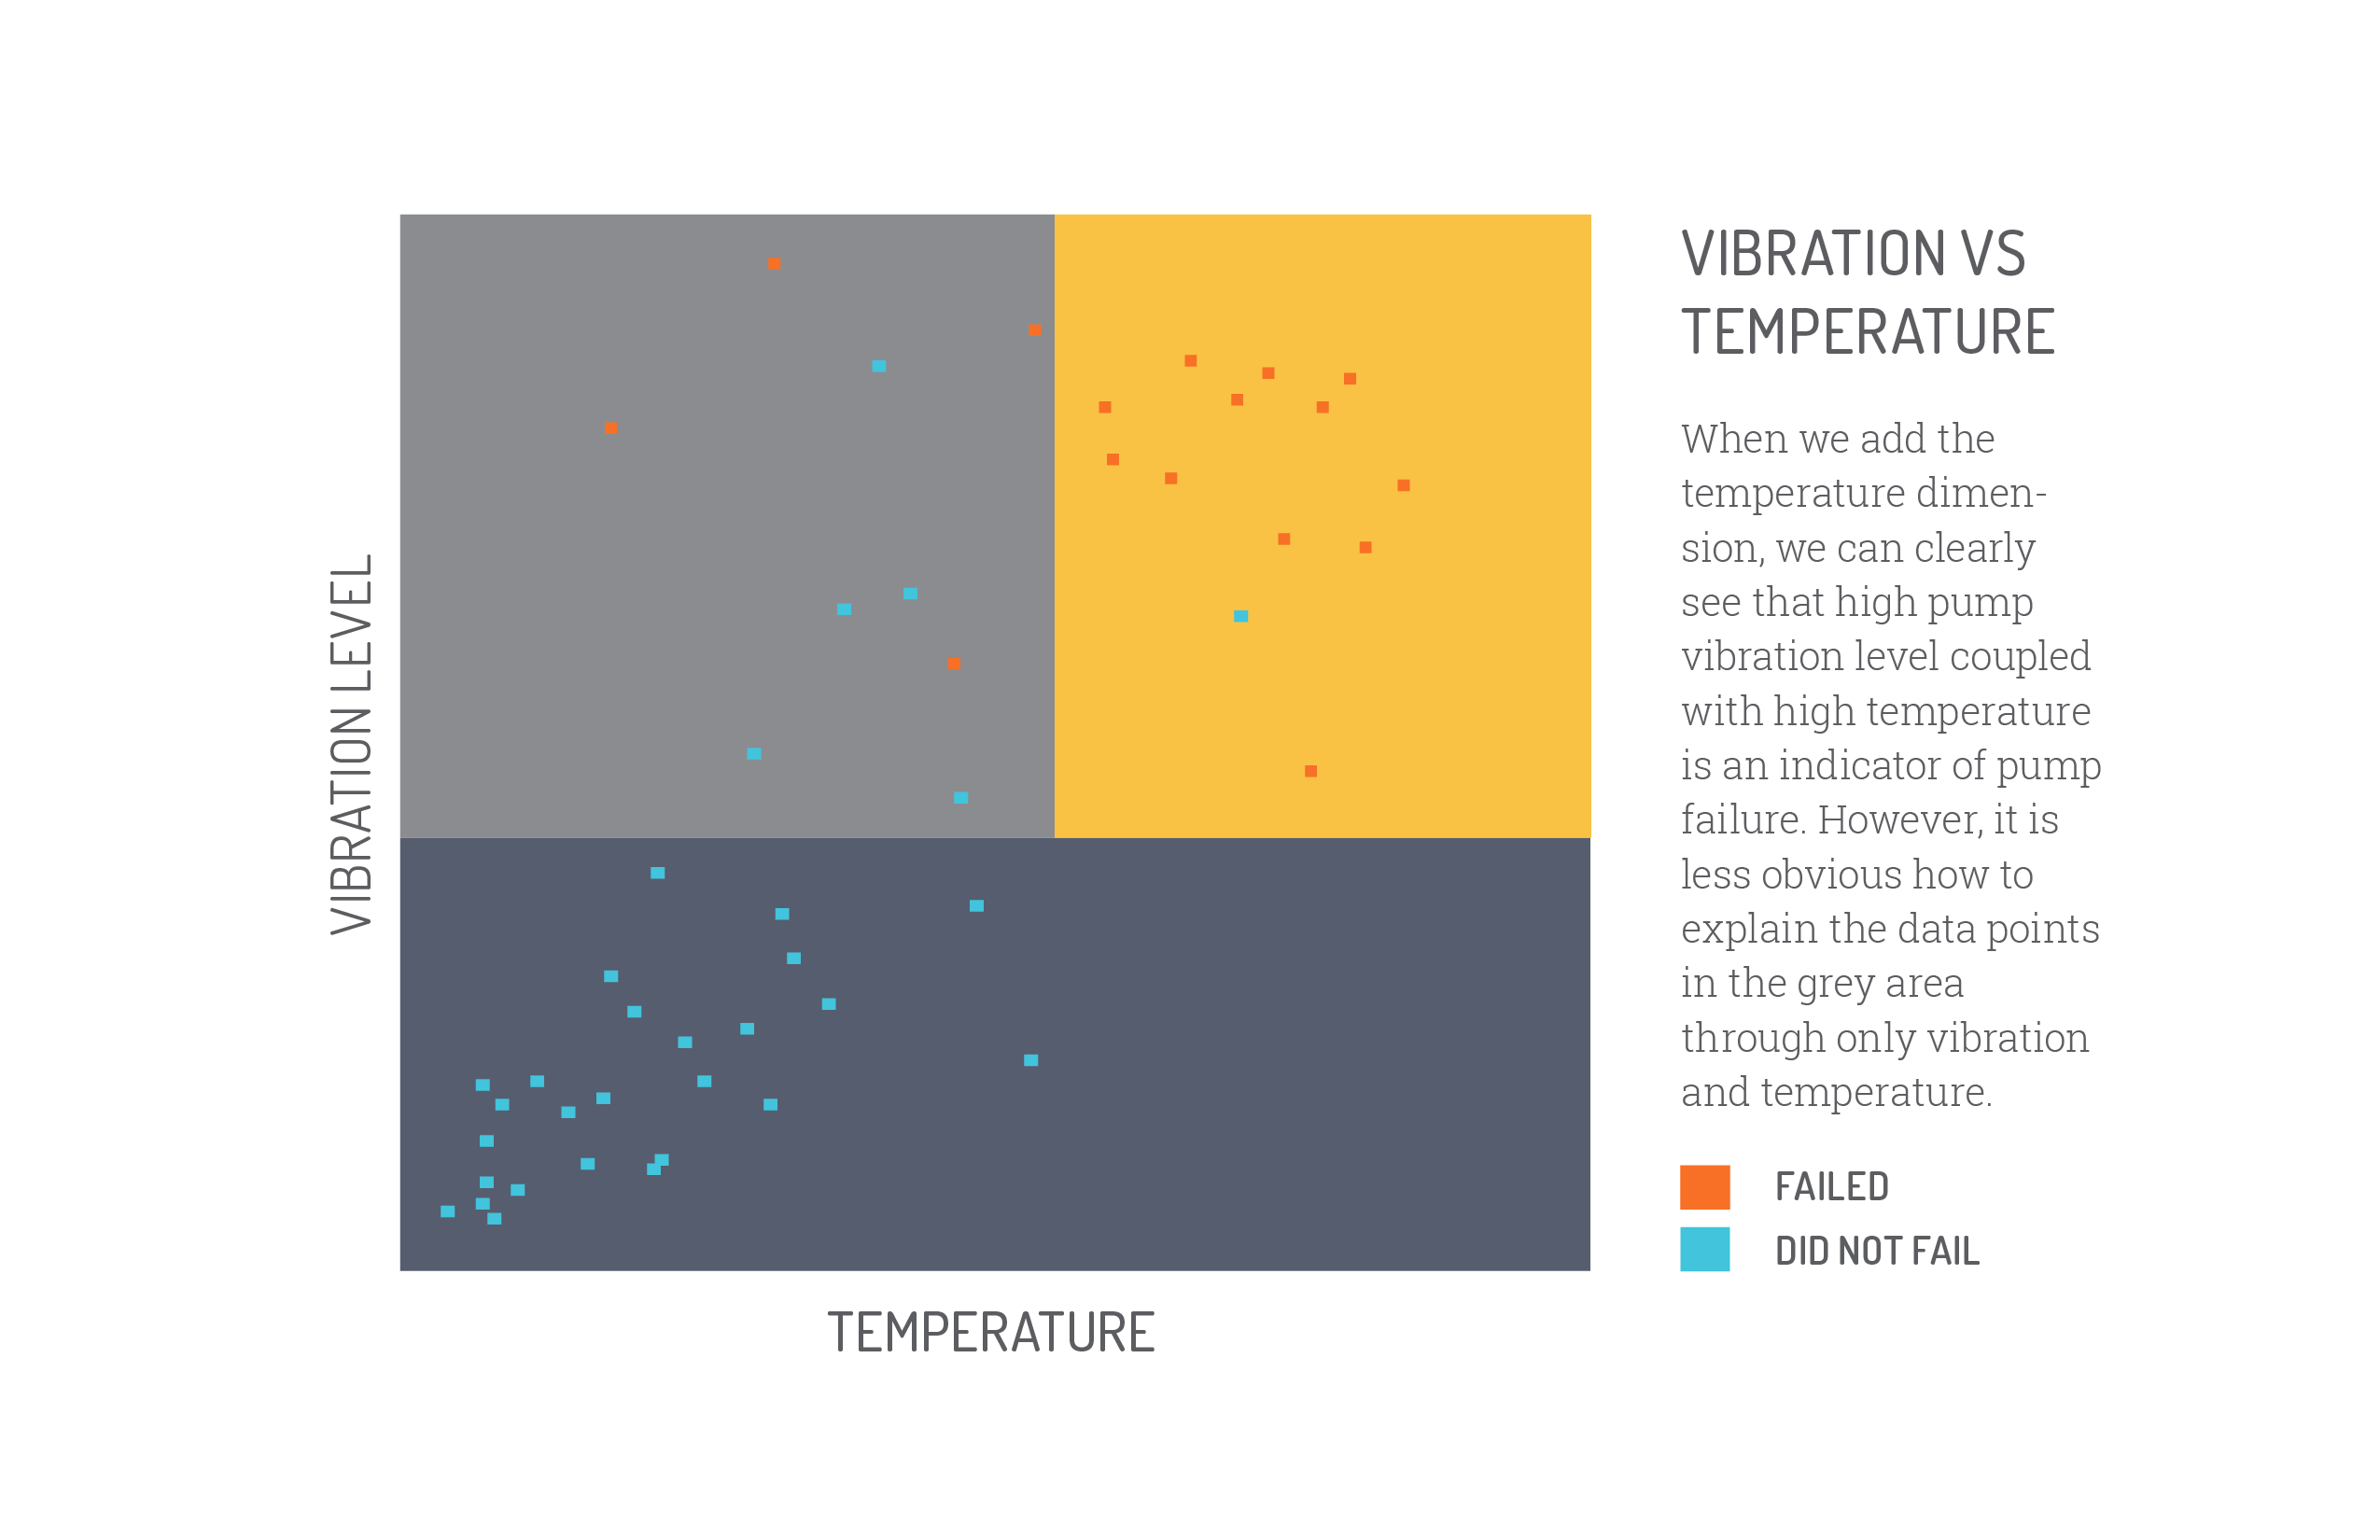
- Classification groups device behavior by outcome into buckets — for predicting pump failure, the simplest version is just two buckets: will fail and will not fail. Vibration alone is rarely enough to predict failure reliably (plenty of high-vibration pumps don’t fail), so classification models typically combine multiple variables — vibration, time since last serviced, temperature — into a classification tree that segments behavior more reliably than any single metric could. The more variables added, the more accurate the model can become, but also the more complex the underlying logic gets.
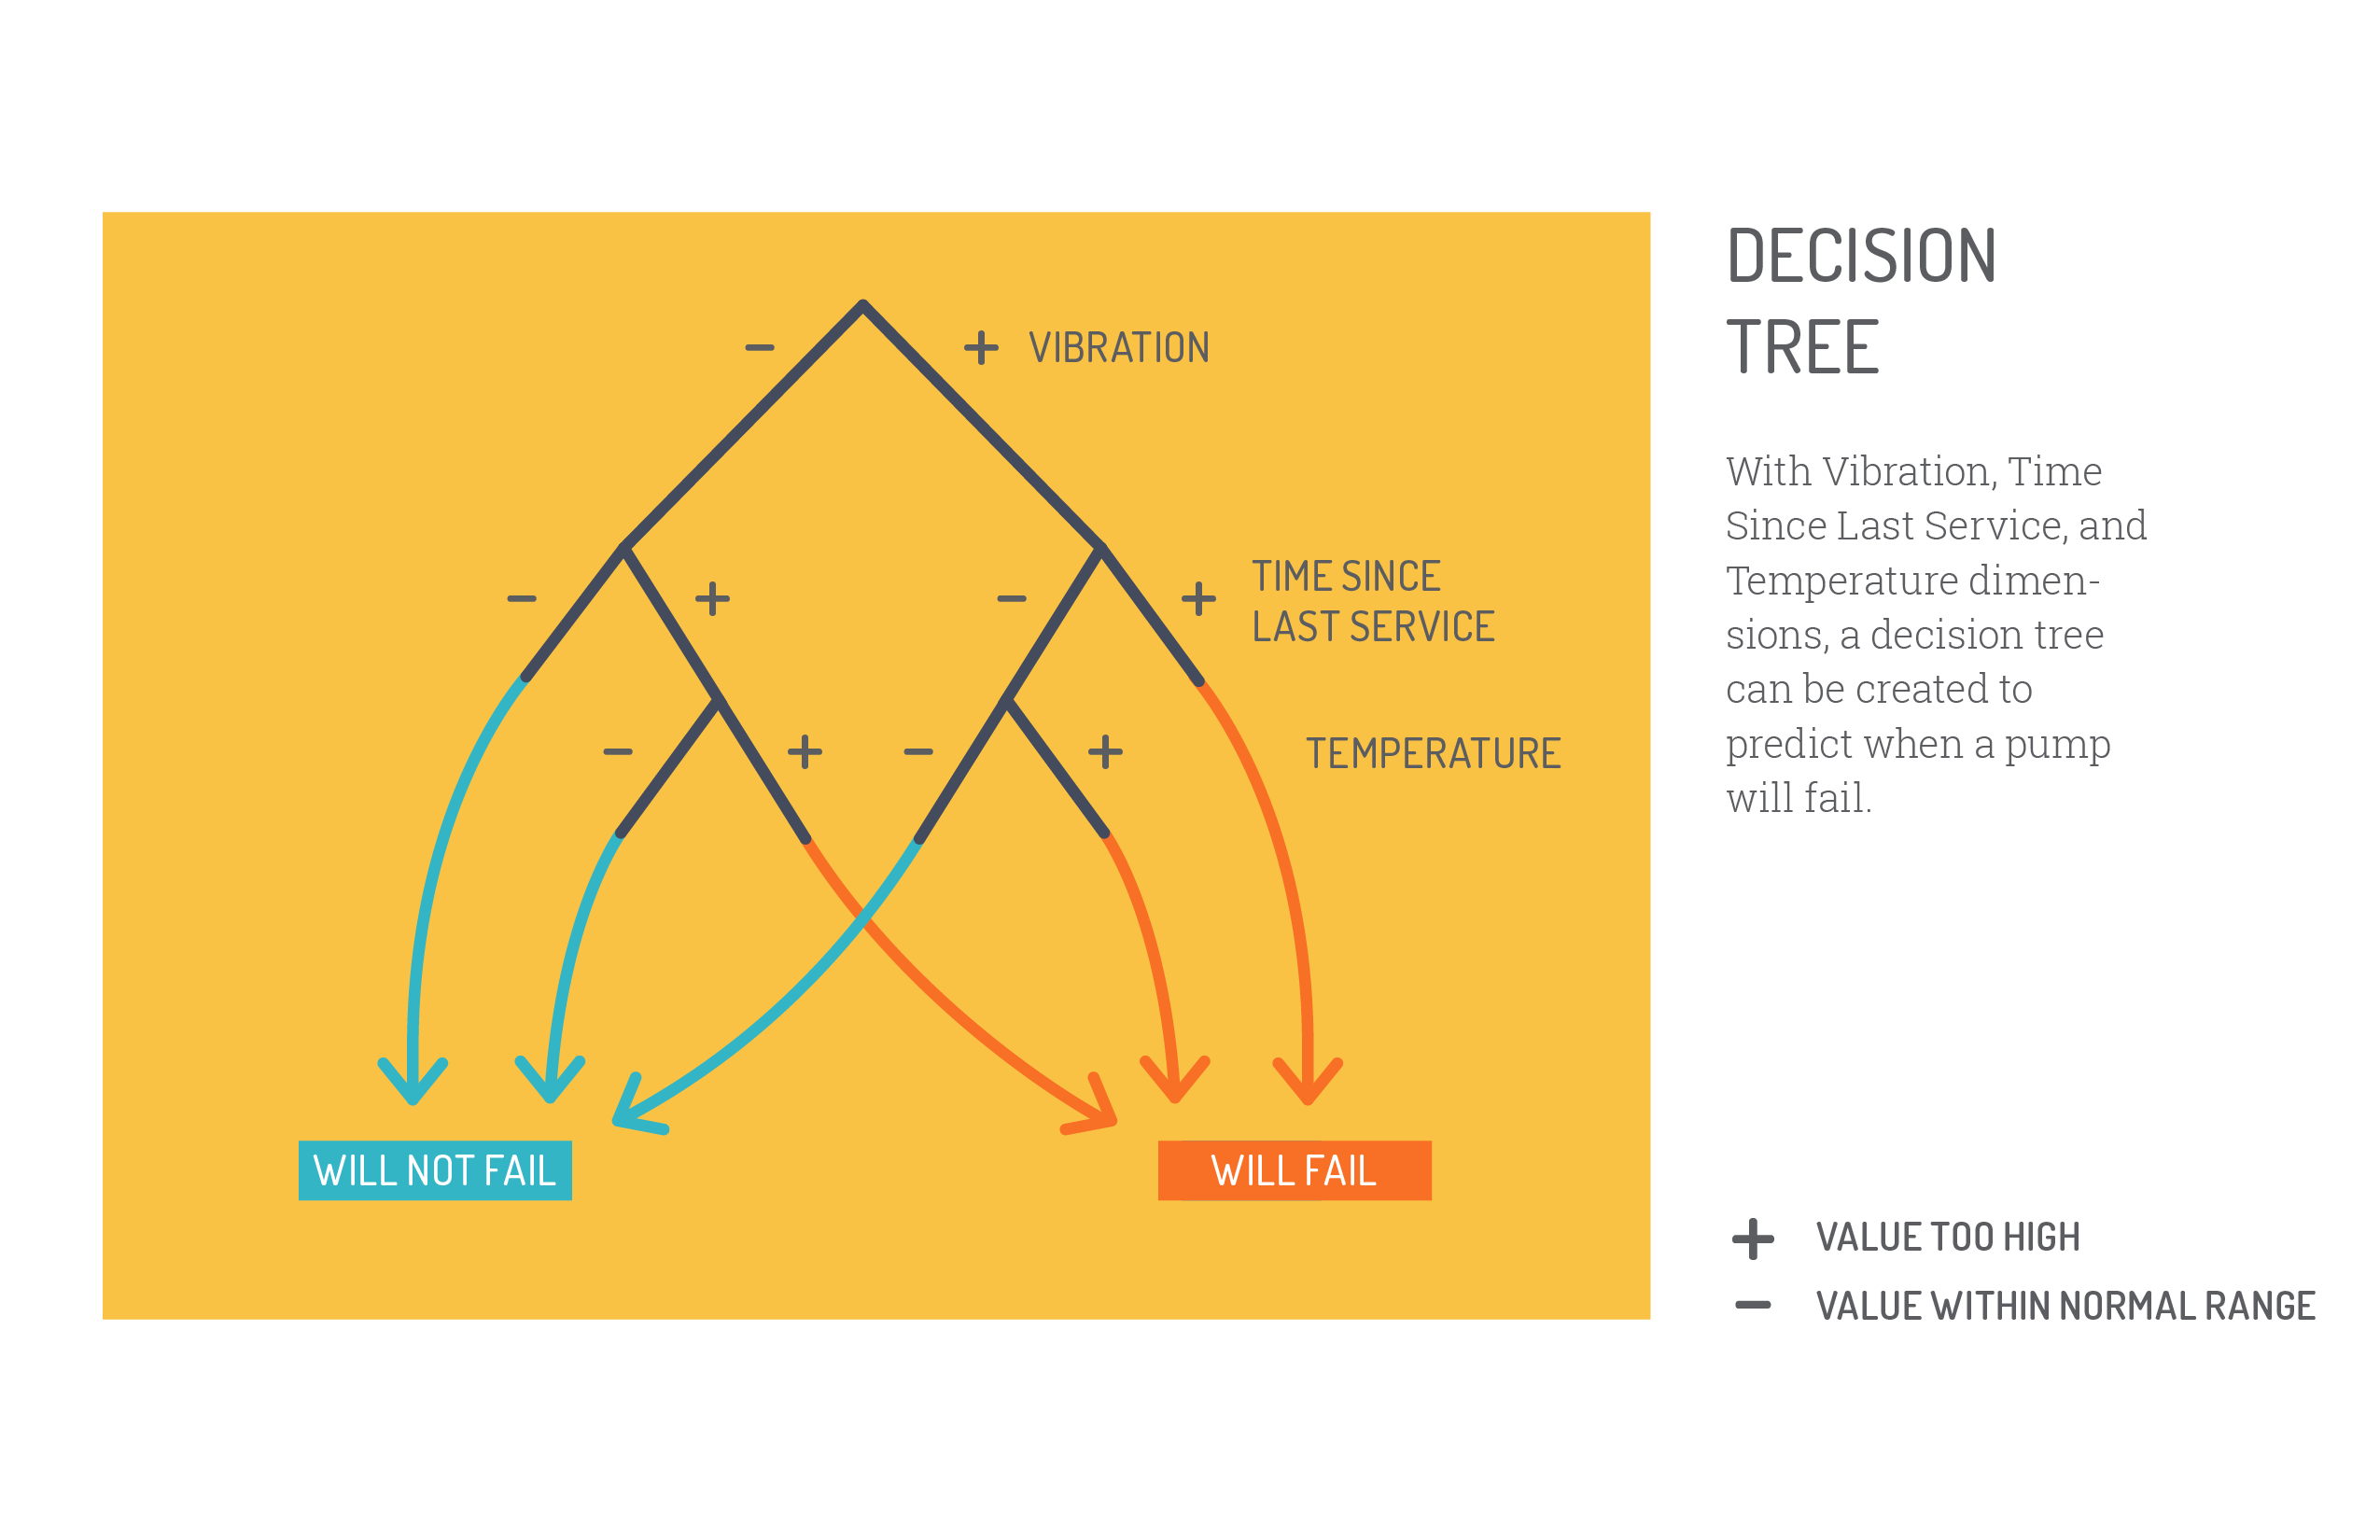
- Random forests combat the overfitting risk that comes with a single classification tree built too closely around one sample data set. A random forest builds many classification trees on many subsets of the sample and averages their results, producing much more stable predictive power than any single overfitted tree.
Prescriptive analytics: what should be done?
The final stage derives actionable items from the predictions made in earlier stages. Whether that becomes decision support (a prioritized maintenance schedule that a human still acts on) or decision automation (a load-bearing pump that shuts itself down safely and automatically orders a replacement part) depends entirely on the application — how much complexity is involved, how fast a response is required, and how much risk is acceptable in acting without a human in the loop.
Turning insight into action
For enterprises building connected products, collecting data isn’t enough — data without context is meaningless, and there’s no one-size-fits-all analytics solution. The right mix of descriptive, diagnostic, predictive, and prescriptive analytics changes for every application. In-house expertise on your own products, services, and markets, paired with outside analytics experience, is what lets an organization build the analytics program best suited to its own business.
To find business-changing insight in your data, start with a standardized collection process built on three questions: What are your unanswered questions — do you need to predict when a device will fail, understand service intervals, or segment your users? Do you have enough data to answer them, and if not, what else needs to be measured? As the number of connected devices grows into the tens of billions and the cost of collecting data keeps falling, the companies that take charge of their data analysis — and find ways to monetize it — will pull ahead of the competition.