
October 15, 2025
Product Updates: See Status at a Glance with Custom Value Interpretation
By Mike Aanenson · 1 min read · Product
A number on a dashboard is useful. A number that turns red when it matters is faster, and faster is what an operator walking past a wall of monitors actually needs.
Custom Value Interpretation
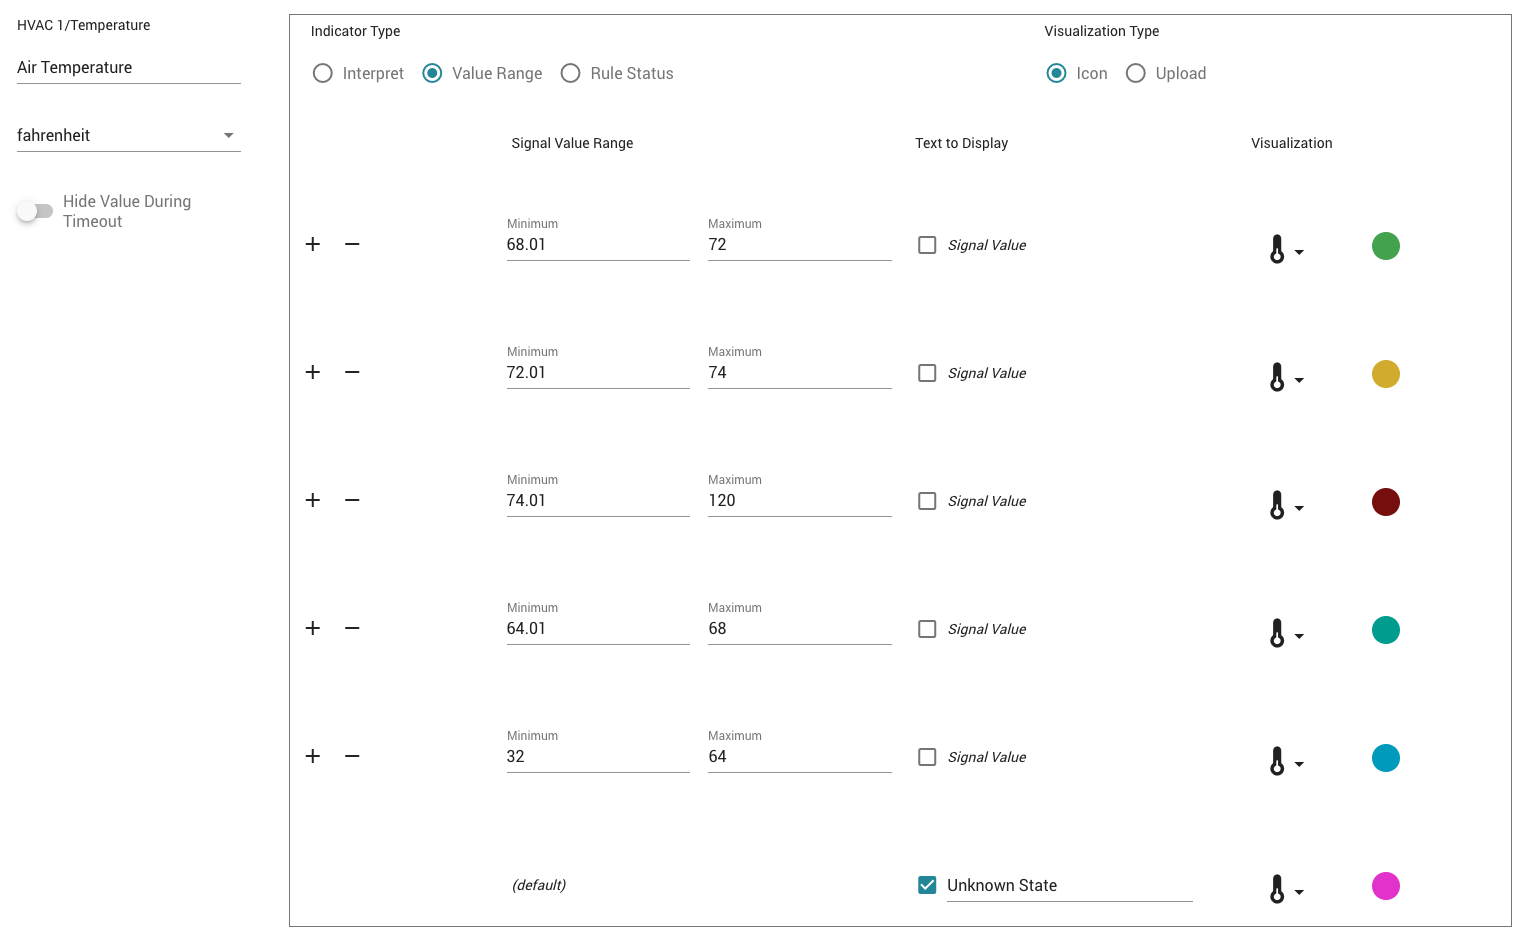
Define value ranges for a Current Value panel and assign each range its own color and icon: green and a checkmark for normal operating temperature, yellow and a warning triangle as it climbs, red and a stop icon once it’s past spec. The panel still shows the real number; it just adds a status layer on top that reads in half a second instead of five.
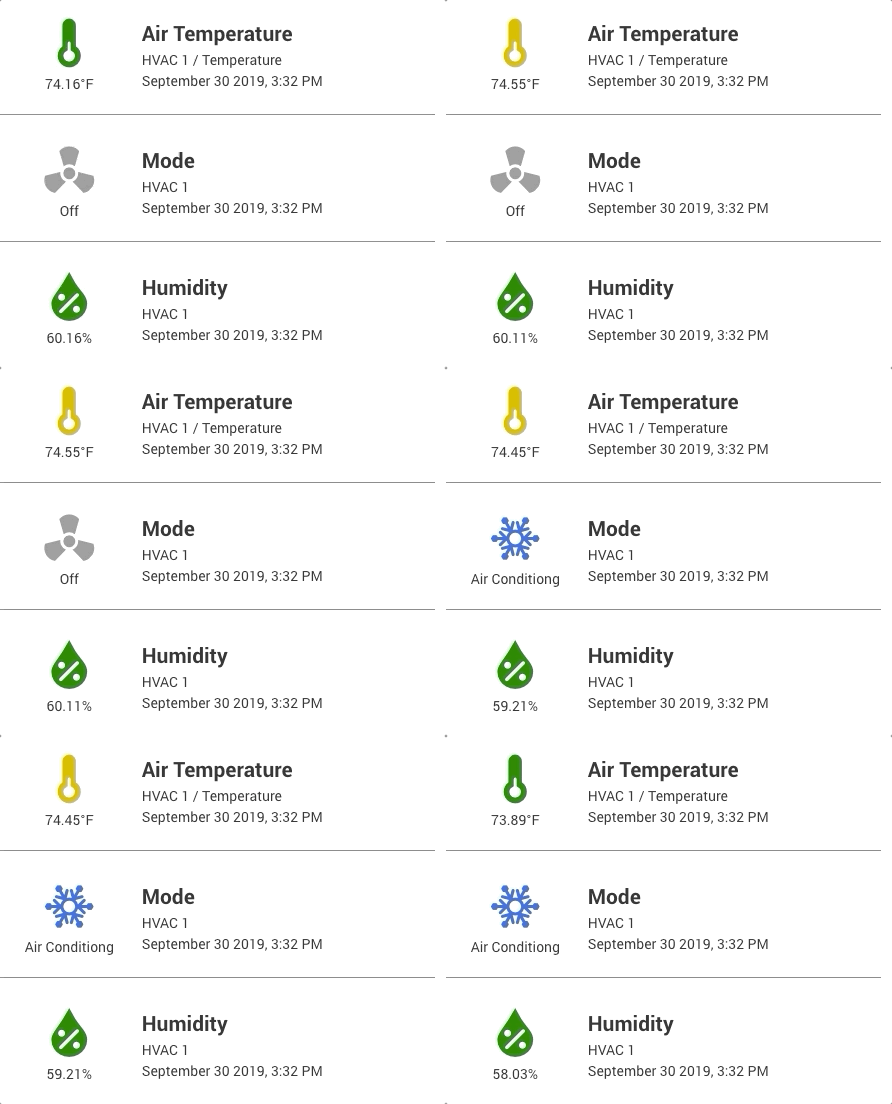
Number formatting in Content Viewer panels was also improved, so units stay consistent alongside the new status indicators.
A discharge-pressure signal set up with three ranges - normal, watch, and alarm - turns a dashboard of forty pumps into something a plant manager can scan in a few seconds rather than reading forty individual numbers.
Full release notes: 2025 archive, v3.3.0. Panel documentation: Panel: Key Indicator - Exosite Documentation.
Schedule a Demo to build a status-at-a-glance dashboard for your equipment.