
May 12, 2025
Product Updates: More Flexible Bar Charts & Key Indicators
By Mike Aanenson · 1 min read · Product
Dashboards are how most people experience ExoSense day to day, so small improvements to how data gets charted add up.
Bar Chart Display Options
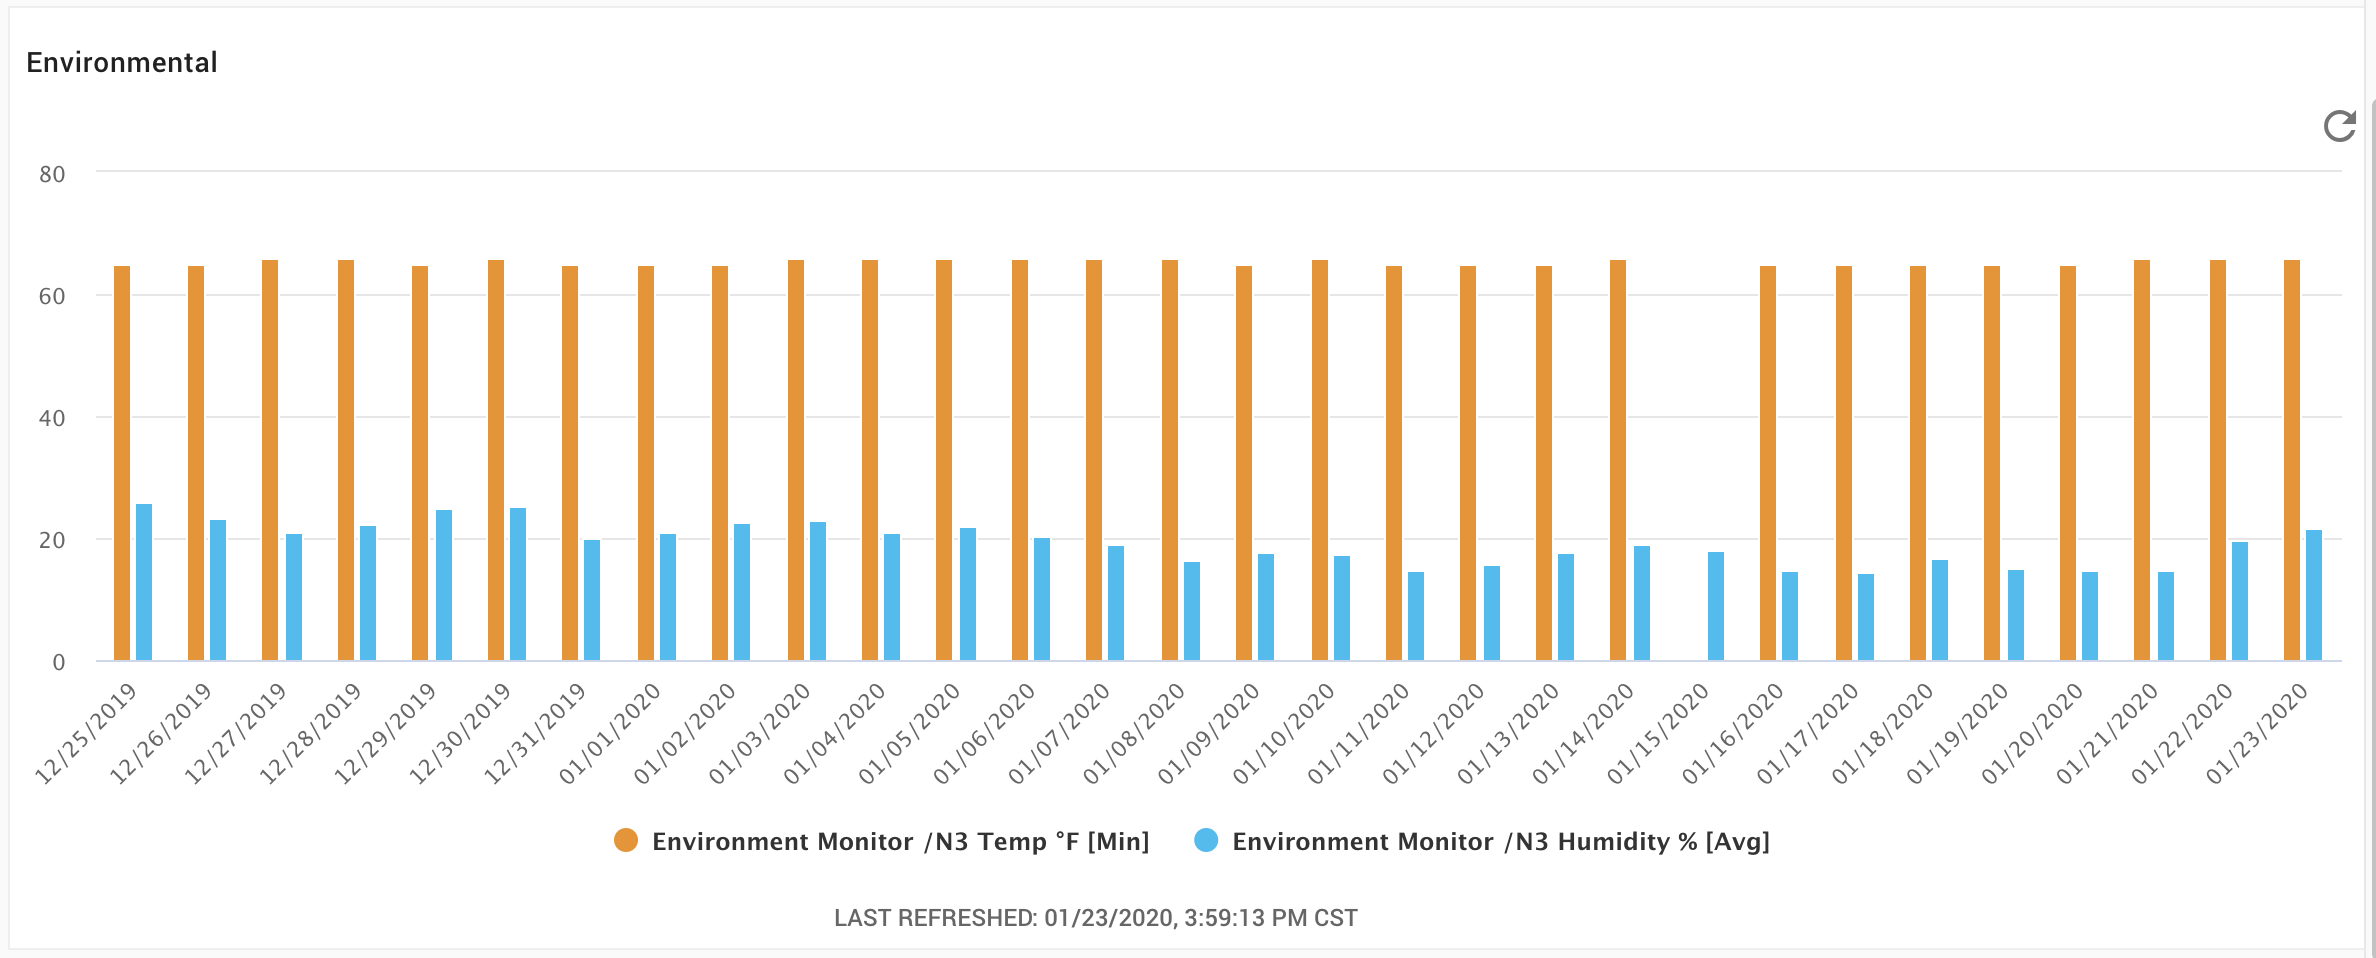
Bar Charts now support columns, area, line, step, and scatter display types, plus a static baseline - a target line or spec limit that doesn’t move with the data. The series limit per chart is up from 3 to 10, useful for comparing several similar assets side by side - say, output across ten identical pumps in a group.
Key Indicator Signal Support
A Bar Chart can now pull in a signal explicitly flagged as a Key Indicator, so a dashboard builder can call out the handful of measurements that matter most for a given asset type without digging through every signal on it.
Comparing eight identical compressors on one bar chart, each bar showing this week’s run hours against a shared target line, makes it obvious in seconds which units are falling behind.
Full release notes: 2025 archive, v2.47.1. Bar Chart documentation: Panel: Bar (Mixed) Chart - Exosite Documentation.
Schedule a Demo to see a fleet comparison dashboard built for your equipment.