
August 19, 2026
Product Updates: Track Asset State Duration with the State Timeline Panel
By Mike Aanenson · 1 min read · Product
Uptime is the number every equipment operator cares about, but most dashboards only ever show it as a lagging summary - a percentage calculated after the fact. Seeing the shape of it, state by state, over a shift or a week, tells a different story.
State Timeline Panel
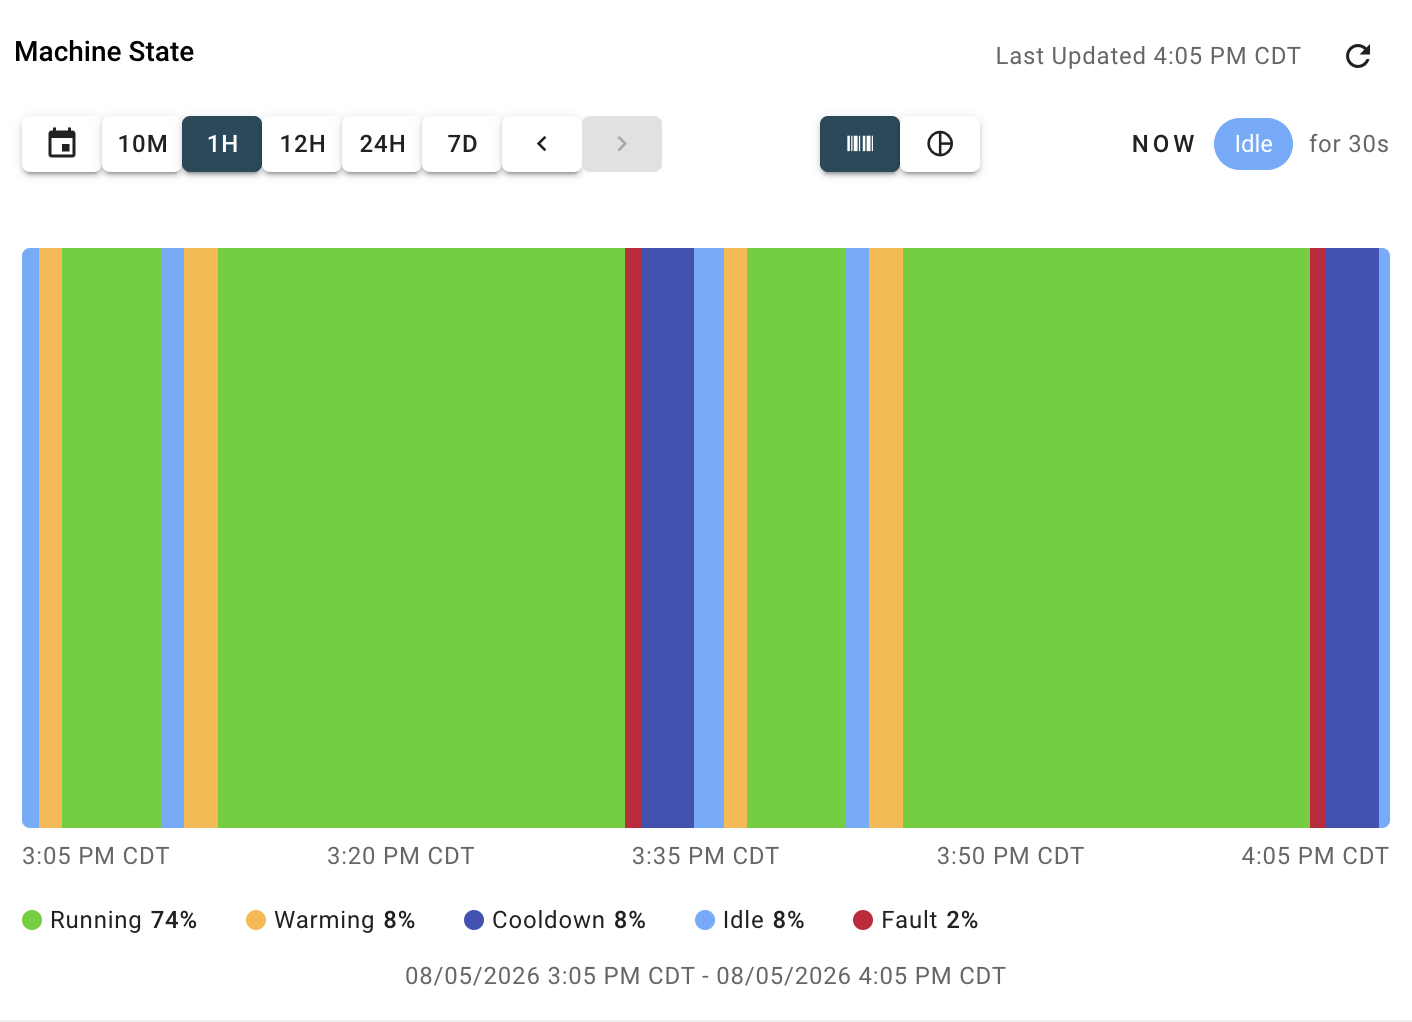
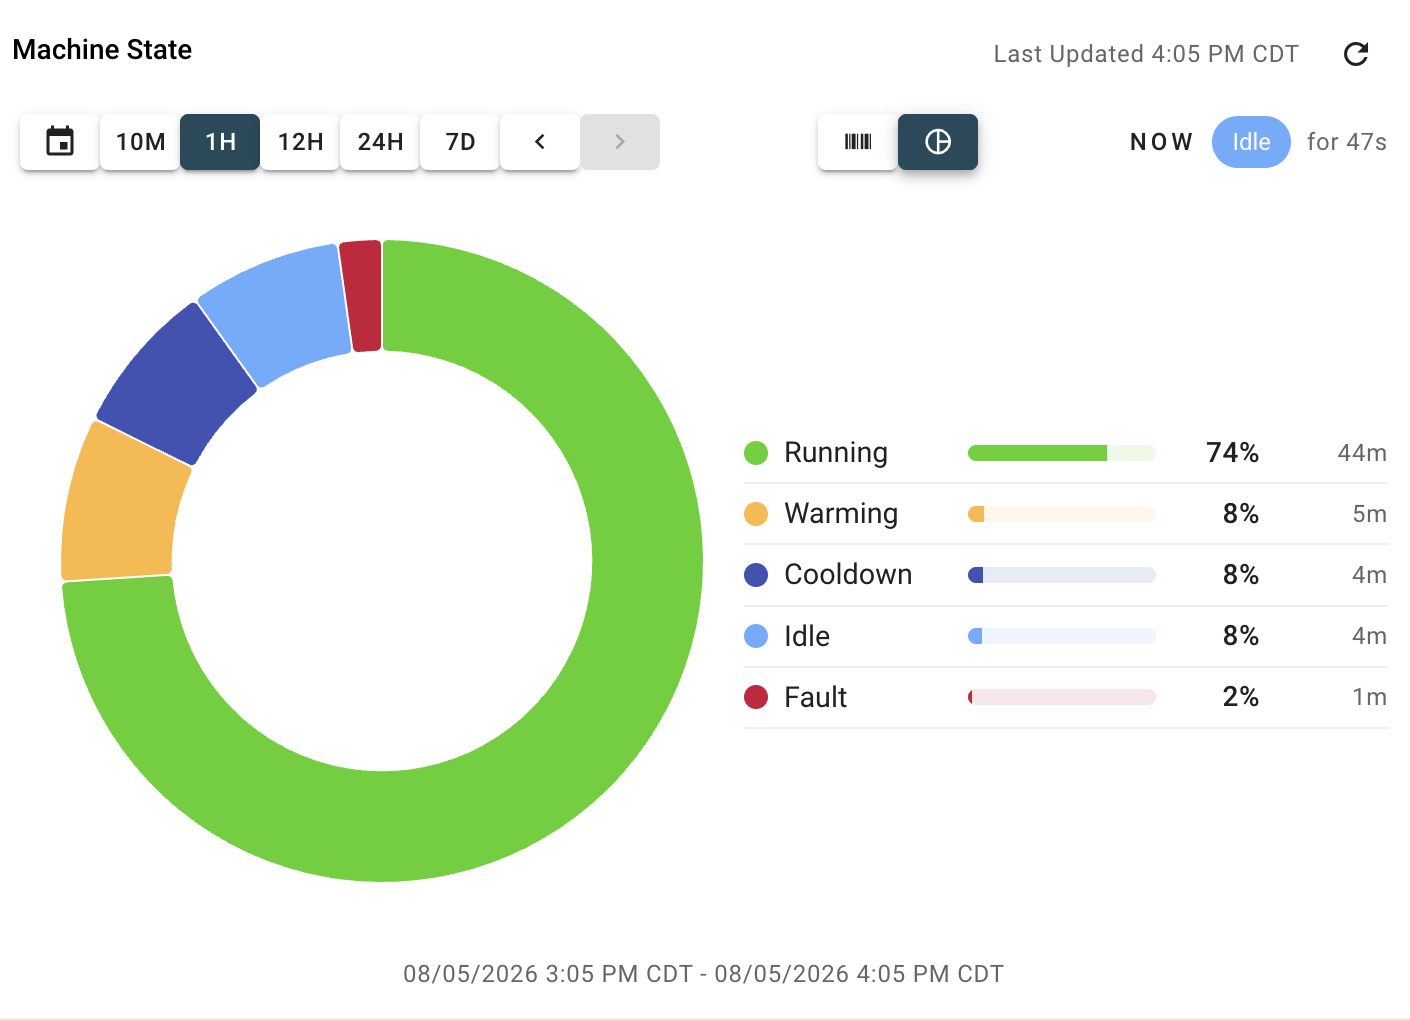
Plots an asset’s state - running, idle, stopped, faulted, or whatever states you define - as a timeline, so it’s immediately visible how long a pump ran this shift, how many times it stopped, and how long each stop actually lasted, rather than a single blended uptime number that hides the pattern. Useful for spotting a machine that’s technically “up” most of the time but stopping and restarting often enough to be worth a maintenance visit.
Configurable Signal Log Panel
A new dashboard panel for categorical, non-numeric data - fault codes, operating modes, batch IDs - displayed as a chronological log rather than forced onto a numeric chart.
A bottling line’s State Timeline might show 94% uptime for the week - a fine number on its own - but reveal eleven short stops clustered on the same shift, a pattern worth a maintenance conversation that the uptime percentage alone would never surface.
Full release notes: current release notes, v3.36.0. Panel documentation: Panel: State Timeline - Exosite Documentation.
Want to see the real shape of your equipment’s uptime? Schedule a Demo.