
October 23, 2024
Product Updates: Bring Your Own Units - Signal Visualization & Dynamic Unit Selection
By Mike Aanenson · 1 min read · Product
The same pump can report pressure in bar to an engineer in Germany and PSI to a technician in Texas - same sensor, same data, different unit a person actually thinks in. Forcing everyone onto one unit system, or hand-building separate dashboards per region, isn’t a real answer for an OEM selling the same equipment worldwide.
Signal Visualization Units
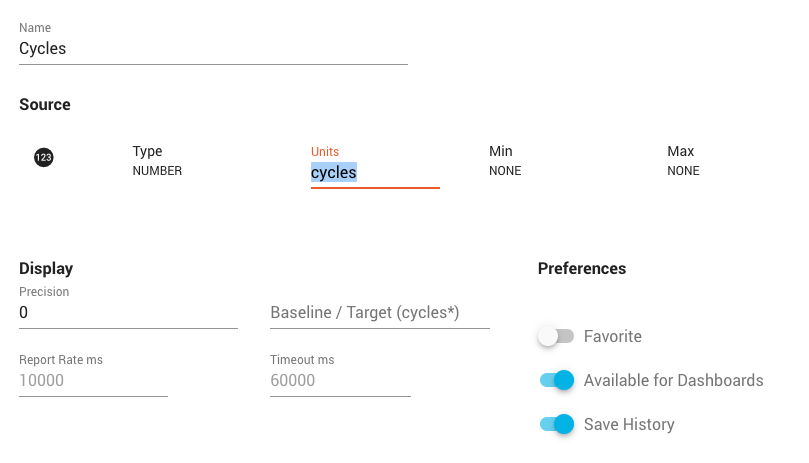
A signal can now specify optional visualization units for both the Metric and US unit systems, separate from whatever unit its source data actually arrives in. Dashboard panels can be configured to dynamically switch between them based on each user’s own visualization preference, so the same dashboard shows bar to one person and PSI to another without maintaining two copies of it.
Signal Property Editing
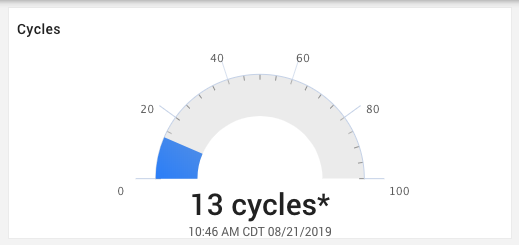
The signal editor also picked up Min/Max property fields, used by dashboard panels that offer an automatic range setting - a gauge or line chart can size its scale off these properties instead of requiring an exact range typed in by hand for every asset.
Also in This Release
Bar and column chart series became customizable per chart, and Asset Types gained their own unit visualization settings - useful for setting a sensible default unit system once per asset type rather than per individual asset.
This release pairs naturally with the language additions from two months earlier - between the two, a dashboard can now speak an operator’s language and show their numbers in the units they actually use.
Full release notes: 2024 archive, v2.46.10 and v2.46.12.
Selling the same equipment into more than one region? Schedule a Demo.